이번에는 Theme Builder라는
색상 변경 및 css를 조정할 수 있는
아주 유용한 기능을
살펴 보도록 하겠습니다!!
테마 설정은 색상 스타일을 변경하는 가장 간단한 방법입니다.
예를 들어 예제 페이지에서 dark mode로 전환하고 다른 테마의 결과를 볼 수 있습니다.

dark mode로 전환한 후 Option Preview에 들어가 보면,
darkMode: true로 변경되어 있고 사용된 color array까지
모두 확인할 수 있습니다.
다른 테마는 기본적으로 포함되어 있지 않으며 사용하려면 직접 다운로드해야 합니다.
테마는 theme builder에서 방문 및 다운로드할 수 있습니다.
테마를 만들거나 편집할 수도 있습니다.
default Theme 중 하나를 선택하면 이미 만들어진 조합들을
확인할 수 있고, 원하는 대로 색상을 변경하는 것도 가능합니다.
저는 Examples 페이지에서 Dark Mode로 변환했을 때의
색상들을 참고하여 새롭게 Dark Theme을 만들어 봤어요.😊
원하는 Theme을 Default에서 선택하거나, 조합한 후 download를 누릅니다.
그럼 두 가지 버전으로 다운이 가능하니
편한 방법으로 하시면 됩니다!
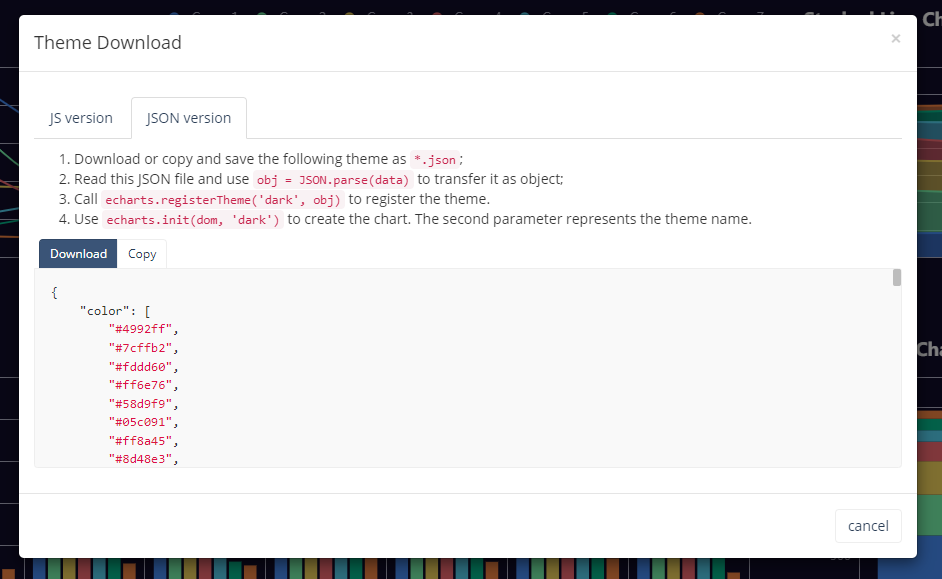
JSON version
1. 테마를 다운로드하거나 복사하여 *.json으로 저장합니다.
2. JSON 파일을 읽고 obj = JSON.parse(data)를 사용하여 객체로 전송합니다.
3. echarts.registerTheme('dark', obj)를 호출하여 테마를 등록합니다.
4. echarts.init(dom, 'dark')를 사용하여 차트를 만듭니다. 두 번째 매개변수는 테마 이름을 나타냅니다.
테마가 JSON 파일로 다운로드되면 직접 등록해야 합니다.
예를 들면 다음과 같습니다.
var xhr = new XMLHttpRequest();
// Assume the theme name is "vintage".
$.getJSON('xxx/xxx/vintage.json', function(themeJSON) {
  echarts.registerTheme('vintage', JSON.parse(themeJSON));
  var chart = echarts.init(dom, 'vintage');
});
JS version
1. 테마를 다운로드하거나 복사하여 *.js 파일로 저장하십시오.
2. 이 파일을 HTML로 인용합니다.
3. echarts.init(dom, 'dark') 를 사용하여 차트를 만듭니다. 두 번째 매개변수는 *.js에 등록된 테마 이름입니다.
테마가 JS 파일로 다운로드되면 자동으로 등록됩니다.
그럼 테마 이름만 아래처럼 넣어주면 바로 사용 가능!
// Import the `vintage.js` file in HTML, then:
var chart = echarts.init(dom, 'vintage');
// ...
Sample code(dark.js)
(function (root, factory) {
if (typeof define === 'function' && define.amd) {
// AMD. Register as an anonymous module.
define(['exports', 'echarts'], factory);
} else if (typeof exports === 'object' && typeof exports.nodeName !== 'string') {
// CommonJS
factory(exports, require('echarts'));
} else {
// Browser globals
factory({}, root.echarts);
}
}(this, function (exports, echarts) {
var log = function (msg) {
if (typeof console !== 'undefined') {
console && console.error && console.error(msg);
}
};
if (!echarts) {
log('ECharts is not Loaded');
return;
}
echarts.registerTheme('dark', {
"color": [
"#4992ff",
"#7cffb2",
"#fddd60",
"#ff6e76",
"#58d9f9",
"#05c091",
"#ff8a45",
"#8d48e3",
"#dd79ff"
],
"backgroundColor": "#100c2a",
"textStyle": {},
"title": {
"textStyle": {
"color": "#ffffff"
},
"subtextStyle": {
"color": "#ffffff"
}
},
"line": {
"itemStyle": {
"borderWidth": 1
},
"lineStyle": {
"width": 2
},
"symbolSize": 4,
"symbol": "circle",
"smooth": true
},
"radar": {
"itemStyle": {
"borderWidth": 1
},
"lineStyle": {
"width": 2
},
"symbolSize": 4,
"symbol": "circle",
"smooth": true
},
"bar": {
"itemStyle": {
"barBorderWidth": 0,
"barBorderColor": "#b9b8ce"
}
},
"pie": {
"itemStyle": {
"borderWidth": 0,
"borderColor": "#b9b8ce"
}
},
"scatter": {
"itemStyle": {
"borderWidth": 0,
"borderColor": "#b9b8ce"
}
},
"boxplot": {
"itemStyle": {
"borderWidth": 0,
"borderColor": "#b9b8ce"
}
},
"parallel": {
"itemStyle": {
"borderWidth": 0,
"borderColor": "#b9b8ce"
}
},
"sankey": {
"itemStyle": {
"borderWidth": 0,
"borderColor": "#b9b8ce"
}
},
"funnel": {
"itemStyle": {
"borderWidth": 0,
"borderColor": "#b9b8ce"
}
},
"gauge": {
"itemStyle": {
"borderWidth": 0,
"borderColor": "#b9b8ce"
}
},
"candlestick": {
"itemStyle": {
"color": "#fd1050",
"color0": "#0cf49b",
"borderColor": "#fd1050",
"borderColor0": "#0cf49b",
"borderWidth": 1
}
},
"graph": {
"itemStyle": {
"borderWidth": 0,
"borderColor": "#b9b8ce"
},
"lineStyle": {
"width": 1,
"color": "#aaaaaa"
},
"symbolSize": 4,
"symbol": "circle",
"smooth": true,
"color": [
"#4992ff",
"#7cffb2",
"#fddd60",
"#ff6e76",
"#58d9f9",
"#05c091",
"#ff8a45",
"#8d48e3",
"#dd79ff"
],
"label": {
"color": "#ffffff"
}
},
"map": {
"itemStyle": {
"areaColor": "#eee",
"borderColor": "#444",
"borderWidth": 0.5
},
"label": {
"color": "#000"
},
"emphasis": {
"itemStyle": {
"areaColor": "rgba(255,215,0,0.8)",
"borderColor": "#444",
"borderWidth": 1
},
"label": {
"color": "rgb(100,0,0)"
}
}
},
"geo": {
"itemStyle": {
"areaColor": "#eee",
"borderColor": "#444",
"borderWidth": 0.5
},
"label": {
"color": "#000"
},
"emphasis": {
"itemStyle": {
"areaColor": "rgba(255,215,0,0.8)",
"borderColor": "#444",
"borderWidth": 1
},
"label": {
"color": "rgb(100,0,0)"
}
}
},
"categoryAxis": {
"axisLine": {
"show": true,
"lineStyle": {
"color": "#b9b8ce"
}
},
"axisTick": {
"show": true,
"lineStyle": {
"color": "#484753"
}
},
"axisLabel": {
"show": true,
"color": "#b9b8ce"
},
"splitLine": {
"show": true,
"lineStyle": {
"color": [
"#b9b8ce"
]
}
},
"splitArea": {
"show": false,
"areaStyle": {
"color": [
"#eeeeee"
]
}
}
},
"valueAxis": {
"axisLine": {
"show": true,
"lineStyle": {
"color": "#b9b8ce"
}
},
"axisTick": {
"show": true,
"lineStyle": {
"color": "#484753"
}
},
"axisLabel": {
"show": true,
"color": "#b9b8ce"
},
"splitLine": {
"show": true,
"lineStyle": {
"color": [
"#b9b8ce"
]
}
},
"splitArea": {
"show": false,
"areaStyle": {
"color": [
"#eeeeee"
]
}
}
},
"logAxis": {
"axisLine": {
"show": true,
"lineStyle": {
"color": "#b9b8ce"
}
},
"axisTick": {
"show": true,
"lineStyle": {
"color": "#484753"
}
},
"axisLabel": {
"show": true,
"color": "#b9b8ce"
},
"splitLine": {
"show": true,
"lineStyle": {
"color": [
"#b9b8ce"
]
}
},
"splitArea": {
"show": false,
"areaStyle": {
"color": [
"#eeeeee"
]
}
}
},
"timeAxis": {
"axisLine": {
"show": true,
"lineStyle": {
"color": "#b9b8ce"
}
},
"axisTick": {
"show": true,
"lineStyle": {
"color": "#484753"
}
},
"axisLabel": {
"show": true,
"color": "#b9b8ce"
},
"splitLine": {
"show": true,
"lineStyle": {
"color": [
"#b9b8ce"
]
}
},
"splitArea": {
"show": false,
"areaStyle": {
"color": [
"#eeeeee"
]
}
}
},
"toolbox": {
"iconStyle": {
"borderColor": "#cccccc"
},
"emphasis": {
"iconStyle": {
"borderColor": "#666666"
}
}
},
"legend": {
"textStyle": {
"color": "#b9b8ce"
}
},
"tooltip": {
"axisPointer": {
"lineStyle": {
"color": "#eeeeee",
"width": "1"
},
"crossStyle": {
"color": "#eeeeee",
"width": "1"
}
}
},
"timeline": {
"lineStyle": {
"color": "#eeeeee",
"width": 1
},
"itemStyle": {
"color": "#dd6b66",
"borderWidth": 1
},
"controlStyle": {
"color": "#eeeeee",
"borderColor": "#eeeeee",
"borderWidth": 0.5
},
"checkpointStyle": {
"color": "#e43c59",
"borderColor": "#c23531"
},
"label": {
"color": "#eeeeee"
},
"emphasis": {
"itemStyle": {
"color": "#a9334c"
},
"controlStyle": {
"color": "#eeeeee",
"borderColor": "#eeeeee",
"borderWidth": 0.5
},
"label": {
"color": "#eeeeee"
}
}
},
"visualMap": {
"color": [
"#fd665f",
"#ffce34",
"#65b581"
]
},
"dataZoom": {
"backgroundColor": "rgba(47,69,84,0)",
"dataBackgroundColor": "rgba(255,255,255,0.3)",
"fillerColor": "rgba(167,183,204,0.4)",
"handleColor": "#a7b7cc",
"handleSize": "100%",
"textStyle": {
"color": "#eeeeee"
}
},
"markPoint": {
"label": {
"color": "#ffffff"
},
"emphasis": {
"label": {
"color": "#ffffff"
}
}
}
});
}));
저는 JS 방식으로 만들어 봤어요!
dark.js 라는 이름으로 만들어서 sample chart에 적용한 결과
<%@ Page Language="C#" AutoEventWireup="true" CodeFile="togetherGraph.aspx.cs" Inherits="graph_togetherGraph" %>

<!DOCTYPE html>

<html xmlns="http://www.w3.org/1999/xhtml">
<head runat="server">
<meta http-equiv="Content-Type" content="text/html; charset=utf-8"/>
    <meta content='width=device-width, initial-scale=1.0, shrink-to-fit=no' name='viewport' />

    <!-- Fonts and icons -->
	<script src="../assets/js/plugin/webfont/webfont.min.js"></script>
	<script>
		WebFont.load({
			google: {"families":["Lato:300,400,700,900"]},
			custom: {"families":["Flaticon", "Font Awesome 5 Solid", "Font Awesome 5 Regular", "Font Awesome 5 Brands", "simple-line-icons"], urls: ['../assets/css/fonts.min.css']},
			active: function() {
				sessionStorage.fonts = true;
			}
		});
	</script>

	<!-- CSS Files -->
	<link rel="stylesheet" href="../assets/css/bootstrap.min.css"/>
	<link rel="stylesheet" href="../assets/css/atlantis.min.css"/>

    <!-- Chart JS -->
    <script src="../comm/echarts.min.js"></script>
    <script src="../comm/dark.js"></script> <!--dark theme 적용-->

    <title></title>
</head>
<body data-background-color="dark">
    <form id="form1" runat="server">
    <div class="wrapper">
        <div class="main-panel">
            <div class="content">
                <div class="page-inner">
                    <h4 class="page-title">All DATA GRAPH VIEW</h4>
                    <div class="row">
                        <div class="col">
                            <div class="chart-container">
                                        <div id="main" style="height:800px; width:100%;"></div>
                                    </div>
                            <%--<div class="card">
                                <div class="card-body">
                                    <div class="chart-container">
                                        <div id="main" style="height:800px; width:100%;"></div>
                                    </div>
                                </div>
                            </div>--%>
                        </div>
                    </div>
                </div>
            </div>
        </div>
    </div>
    </form>

    <!--   Core JS Files   -->
    <script src="../assets/js/core/jquery.3.2.1.min.js"></script>
    <script src="../assets/js/core/popper.min.js"></script>
    <script src="../assets/js/core/bootstrap.min.js"></script>
    <!-- jQuery UI -->
    <script src="../assets/js/plugin/jquery-ui-1.12.1.custom/jquery-ui.min.js"></script>
    <script src="../assets/js/plugin/jquery-ui-touch-punch/jquery.ui.touch-punch.min.js"></script>
    <!-- jQuery Scrollbar -->
    <script src="../assets/js/plugin/jquery-scrollbar/jquery.scrollbar.min.js"></script>
    <!-- Atlantis JS -->
    <script src="../assets/js/atlantis.min.js"></script>

    <script type="text/javascript">
        var option = {
            title: {
                text: 'Stacked Line'
            },
            tooltip: {
                trigger: 'axis'
            },
            legend: {
                //top:'5%',
                data: ['Email', 'Union Ads', 'Video Ads', 'Direct', 'Search Engine']
            },
            grid: {
                containLabel: true
            },
            toolbox: {
                feature: {
                    saveAsImage: {}
                }
            },
            xAxis: {
                type: 'category',
                boundaryGap: false,
                data: ['Mon', 'Tue', 'Wed', 'Thu', 'Fri', 'Sat', 'Sun']
            },
            yAxis: {
                type: 'value'
            },
            series: [
              {
                  name: 'Email',
                  type: 'line',
                  stack: 'Total',
                  data: [120, 132, 101, 134, 90, 230, 210],
                  blendMode: 'lighter'
              },
              {
                  name: 'Union Ads',
                  type: 'line',
                  stack: 'Total',
                  data: [220, 182, 191, 234, 290, 330, 310]
              },
              {
                  name: 'Video Ads',
                  type: 'line',
                  stack: 'Total',
                  data: [150, 232, 201, 154, 190, 330, 410]
              },
              {
                  name: 'Direct',
                  type: 'line',
                  stack: 'Total',
                  data: [320, 332, 301, 334, 390, 330, 320]
              },
              {
                  name: 'Search Engine',
                  type: 'line',
                  stack: 'Total',
                  data: [820, 932, 901, 934, 1290, 1330, 1320]
              }
            ]
        };

        window.onload = function () {
            //dark theme 적용
            window.myChart = echarts.init(document.getElementById('main'), 'dark');

            //graph resize
            $(window).on('resize', resize);
            function resize() {
                setTimeout(function () {
                    window.myChart.resize();
                }, 100);
            }

            window.myChart.setOption(option);
        }
    </script>
</body>
</html>
bootstrap을 적용한 파일에서 사용해 봤는데 잘 나옵니다!
색상 외에도 graph에 적용하고 싶은 style을 추가해서
사용할 수도 있으니 필요한 부분 찾아보시고 사용하시면 될 것 같습니다.
'Just Do It > Echarts' 카테고리의 다른 글
| Echarts DataZoom (0) | 2022.02.09 |
|---|---|
| Echarts container/size 조절 (0) | 2022.02.08 |
| Echarts 그리기 (3) | 2022.02.07 |
| ECharts.js 소개 및 설치 (2) | 2022.02.04 |


