charts가 이미 포함되어 있는 bootstrap theme을 사용하는 것이 아니라면
CDN, npm 또는 직접 다운받아 설치하는 여러 방법으로 chart 작성이 가능합니다.
bootstrap으로 따로 스타일링을 하는 것은 아니니 여러 차트 라이브러리를 소개해볼까 합니다.
Chart.js
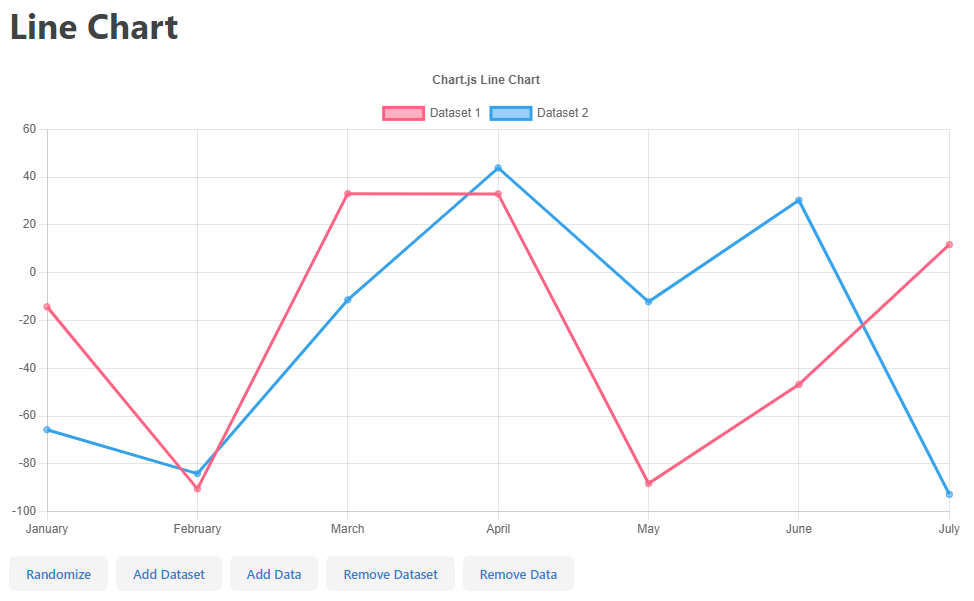
Chart.js 는 디자이너와 개발자를 위한 간단하면서도 유연한 JavaScript 차트입니다.
Chart.js | Open source HTML5 Charts for your website
New in 2.0 New chart axis types Plot complex, sparse datasets on date time, logarithmic or even entirely custom scales with ease.
www.chartjs.org
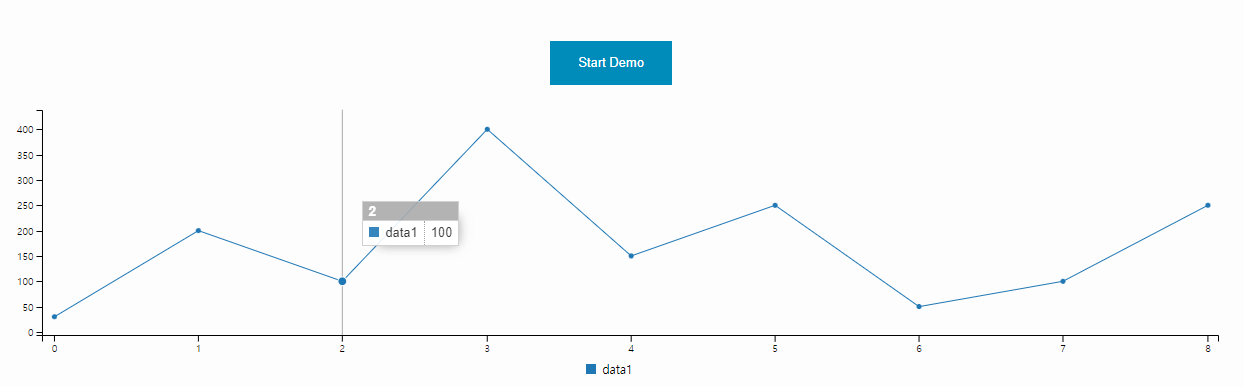
Float.js
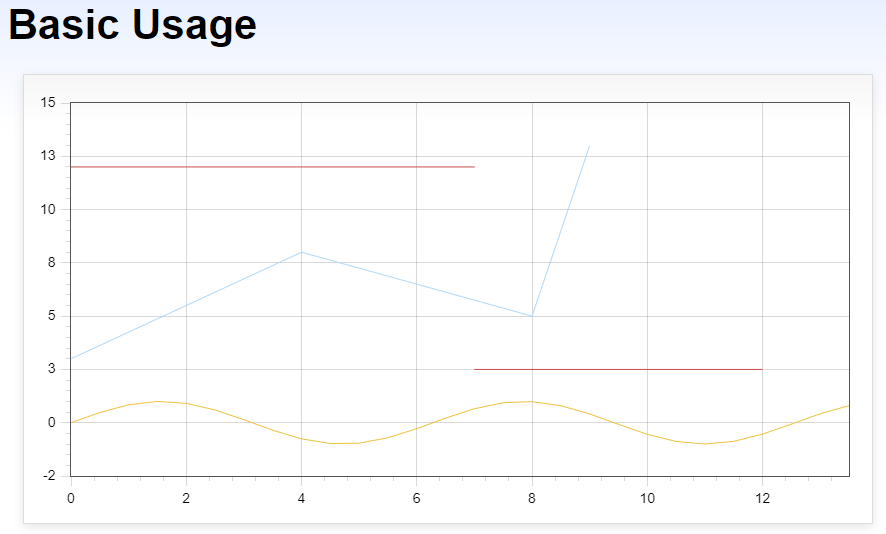
Float.js 는 간단한 사용법, 매력적인 모양 및 대화형 기능에 중점을 둔
jQuery용 순수 JavaScript 플로팅 라이브러리입니다.
Flot: Attractive JavaScript plotting for jQuery
Additional examples are bundled with Flot. Also take a look at the Flot Usage Wiki for screenshots and stories from people and companies using Flot. Documentation If you need more help, consider posting to the friendly gang on the forum/mailing list. You c
www.flotcharts.org
Google chart
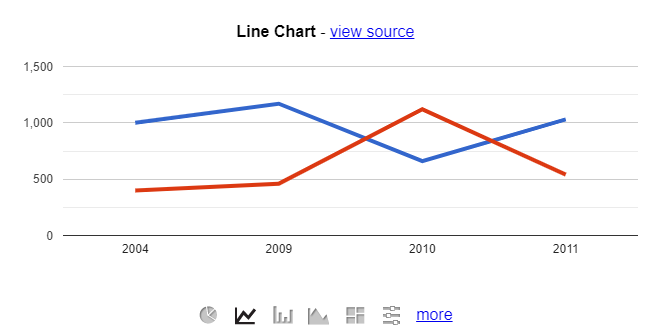
Google 차트 도구는 강력하고 사용이 간편하며 무료입니다.
대화형 차트 및 데이터 도구의 풍부한 갤러리를 사용해 보십시오.
https://developers.google.com/chart
Charts | Google Developers
Interactive charts for browsers and mobile devices.
developers.google.com
D3.js
D3.js 는 데이터를 기반으로 문서를 조작하기 위한 JavaScript 라이브러리입니다.
D3.js - Data-Driven Documents
D3 is a JavaScript library for visualizing data with HTML, SVG, and CSS.
d3js.org
C3.js
C3.js는 D3 기반의 재사용 가능한 차트 라이브러리입니다.
C3.js | D3-based reusable chart library
Comfortable C3 makes it easy to generate D3-based charts by wrapping the code required to construct the entire chart. We don't need to write D3 code any more. Customizable C3 gives some classes to each element when generating, so you can define a custom st
c3js.org
Chartist.js
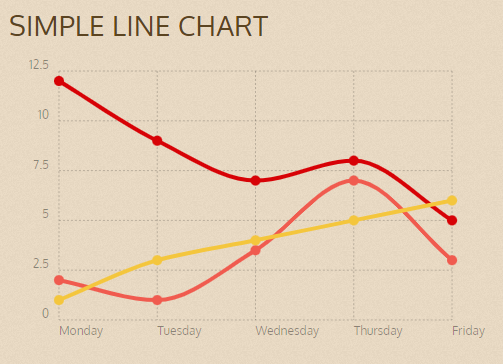
Chartist는 간단한 반응형 차트를 생성합니다.
https://gionkunz.github.io/chartist-js/
Chartist - Simple responsive charts
You may think that this is just yet an other charting library. But Chartist.js is the product of a community that was disappointed about the abilities provided by other charting libraries. Of course there are hundreds of other great charting libraries but
gionkunz.github.io
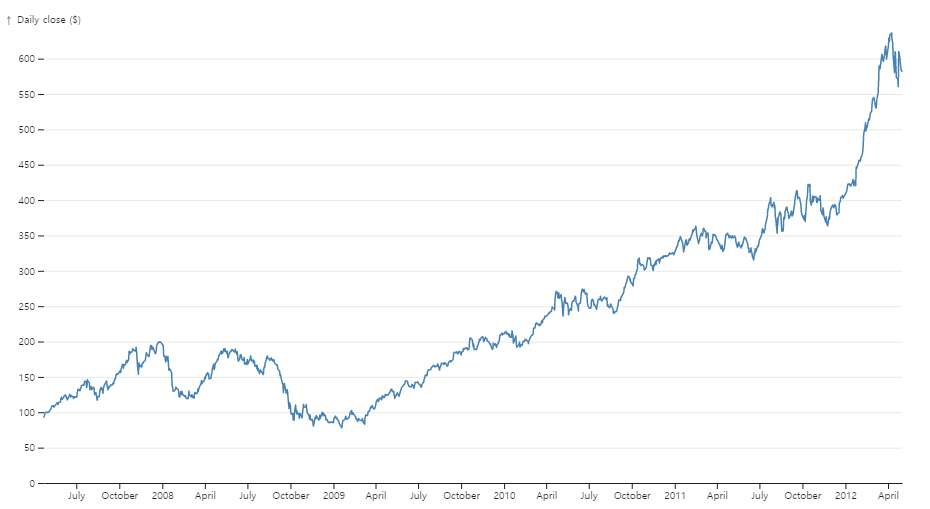
Morris.js

Morris는 예쁜 시계열 선 그래프를 만듭니다.
https://morrisjs.github.io/morris.js/
morris.js
Getting started Add morris.js and its dependencies (jQuery & Raphaël) to your page. 1 2 3 4 If you don’t want to use the CDN-hosted assets, then you can extract them from the zip bundle and upload them to your own site. Your first chart Start by adding
morrisjs.github.io
Sparkline

Jquery Sparkline은 HTML에서 인라인으로 또는 Javascript를 통해 제공된 데이터를 사용하여
브라우저에서 직접 스파크라인(작은 인라인 차트)을 생성합니다.
https://omnipotent.net/jquery.sparkline/#s-about
jQuery Sparklines
Pie charts 1,1,2 1,5 20,50,80 Bullet charts 10,12,12,9,7 14,12,12,9,7 10,12,14,9,7
omnipotent.net
Echarts
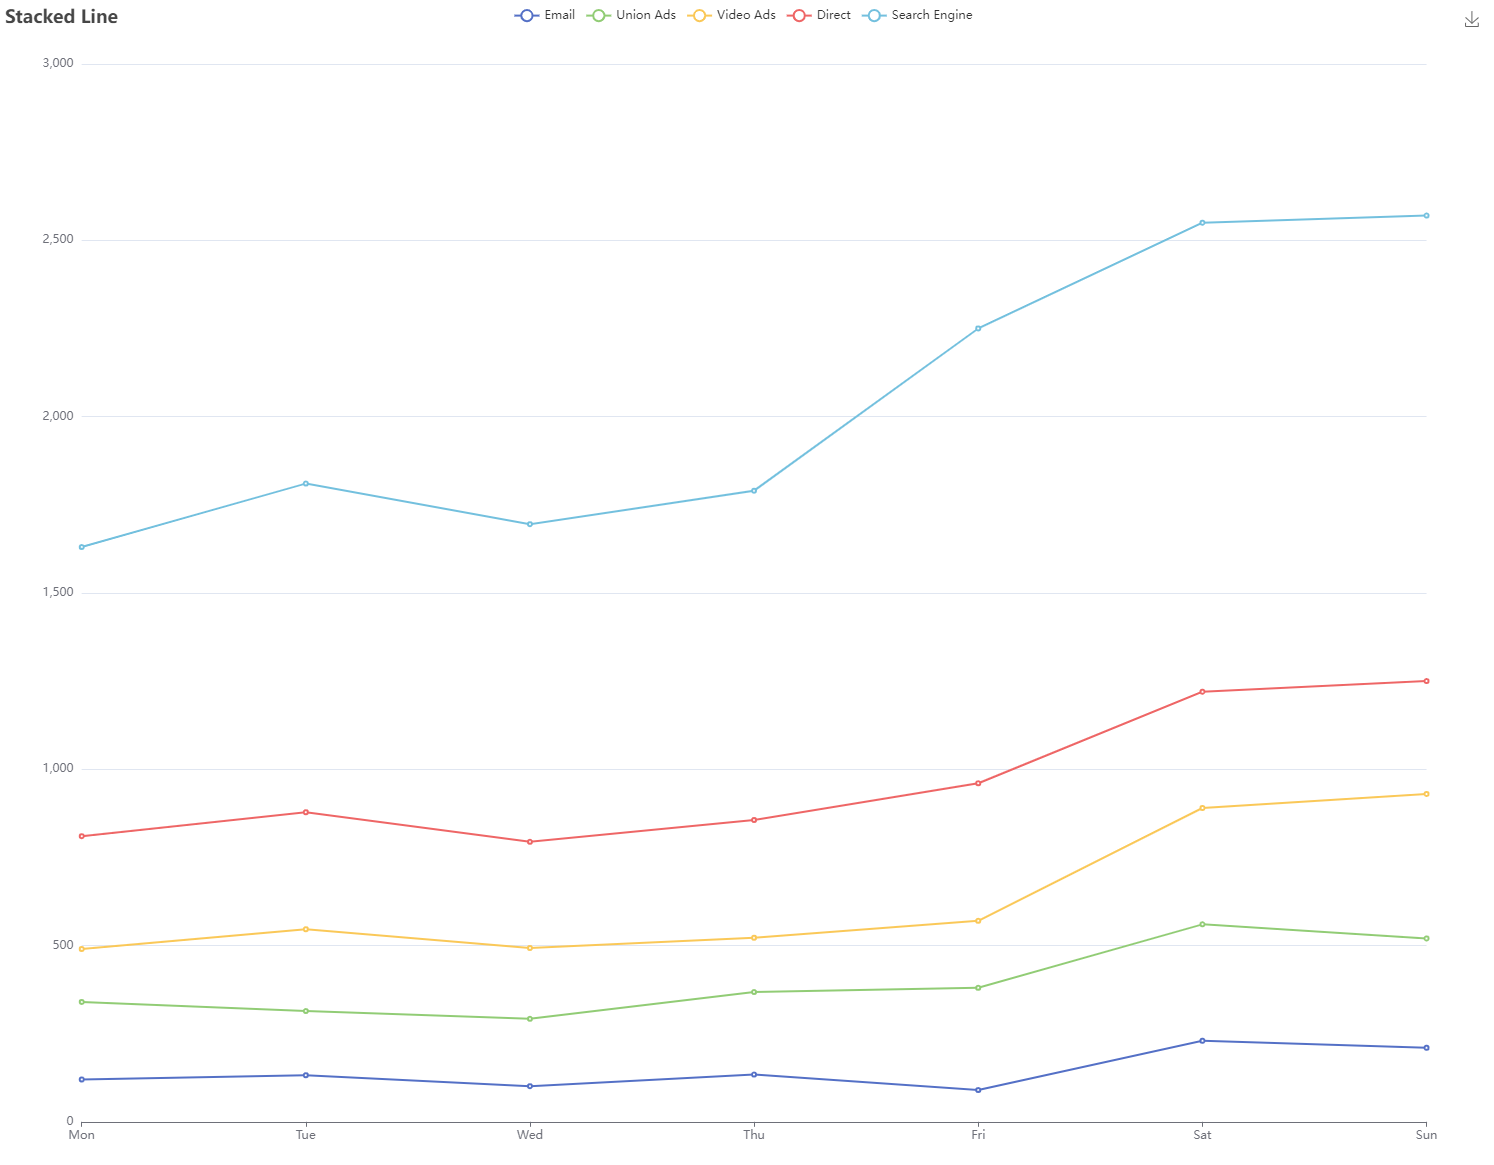
브라우저를 위한 강력한 대화형 차트 및 시각화 라이브러리인 ECharts.
https://echarts.apache.org/en/index.html
Apache ECharts
ECharts: A Declarative Framework for Rapid Construction of Web-based Visualization You are welcomed to cite the following paper whenever you use ECharts in your R&D projects, products, research papers, technical reports, news reports, books, presentations,
echarts.apache.org
'Just Do It > Bootstrap' 카테고리의 다른 글
| Bootstrap - free theme Atlantis 설치 (0) | 2022.02.16 |
|---|---|
| Bootstrap - npm 에러 해결 (0) | 2022.02.15 |
| Bootstrap - free theme <CORONA> Tables (0) | 2022.02.03 |
| Bootstrap Icon (0) | 2022.02.02 |
| Bootstrap - free theme <CORONA> 설치 (0) | 2022.01.28 |


